Historical B/S Indicators for Candlestick Charts
WEEX just got smarter! Review past trades and refine your strategies with our brand-new feature: Historical B/S (Buy/Sell) markers for candlestick charts! Now, you can view your past trades right on the chart, helping you make sharper decisions and trade more efficiently.
Highlights
- Trade records at a glance
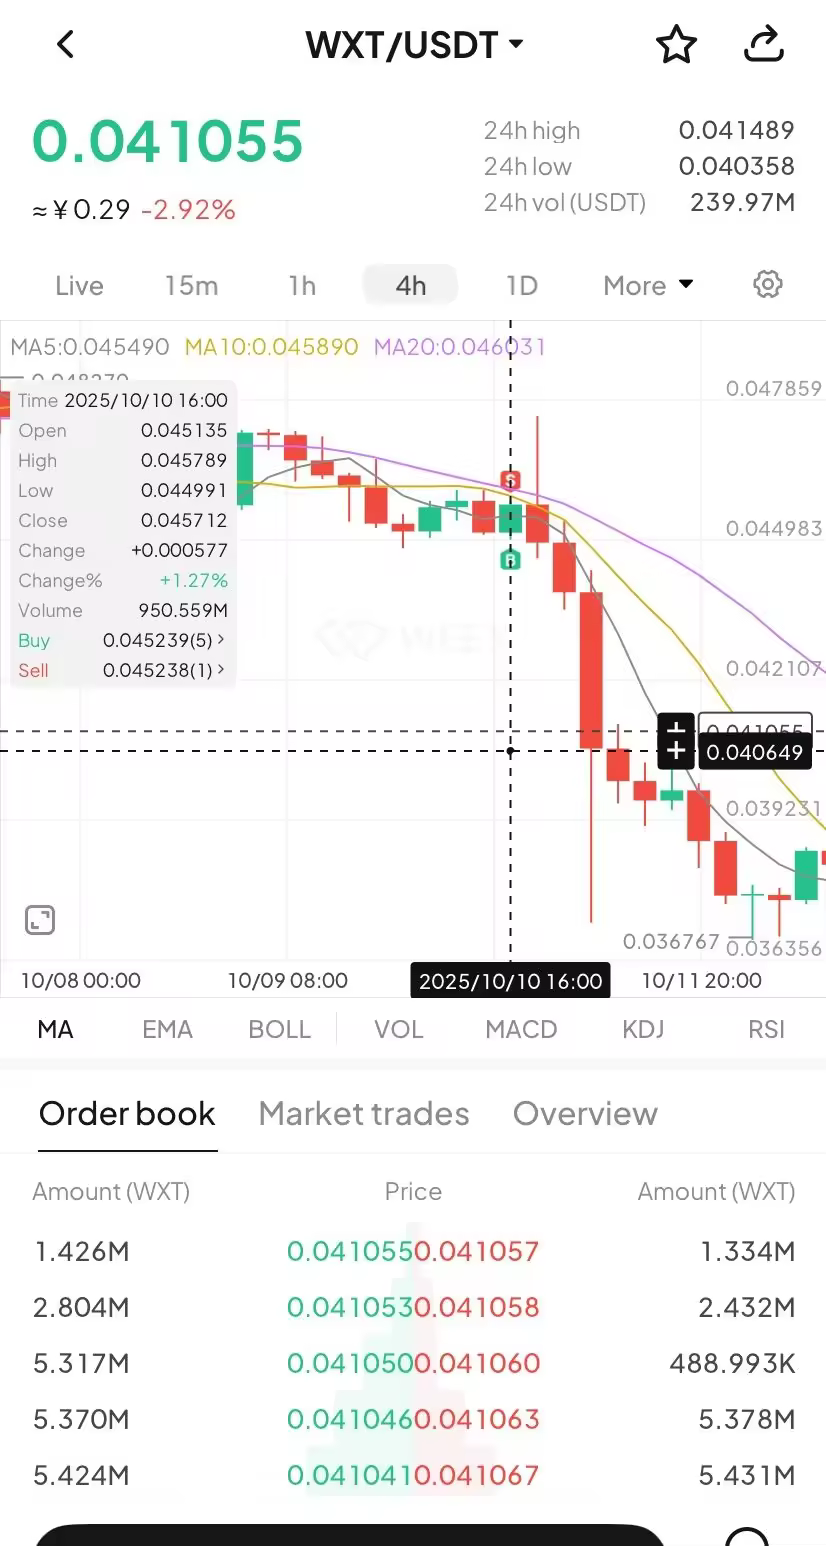
- Your Buy (B) and Sell (S) points are automatically marked on the chart.
- Each marker shows your precise trade time and price, helping you review past orders at a glance.
- Comprehensive coverage
- Spot trading: Full support for marking trades across all spot pairs.
- Futures trading: Clearly shows open and close points, distinguishing between long and short positions.
- Rich interactions
- Tap any marker (B or S) to view detailed trade information, such as:
- Trade time: Review exact trade times and corresponding market conditions.
- Execution price: Displays the average filled price of historical trades.
- Trade count: Quickly check the number of trades in a certain period.
- Markers update dynamically as you zoom and drag the candlestick. Seamlessly review up to 100 executed trades from the last 90 days.
- Universal access
- Available on both iOS and Android: Access your trade history anytime, on any mobile device.
- Full currency coverage: Supports all pairs in your portfolio, across both spot and futures markets.
How to Use?
- Open the WEEX app and go to any pair's chart page.
- Tap the candlestick chart and enable the "Order history" feature in the chart settings (enabled by default.)
- If trades exist for that pair, B and S markers will instantly show up on the chart.
- Tap any marker to check the full details of that transaction.
Where to use it
- Review strategies: Quickly review your buy and sell points combined with market trends to refine your strategy.
- Analyze PnL: Easily pinpoint profitable or losing trades to learn from your past performance.
Understand trends: Combine your trade history with the candlestick chart data for deeper market and behavioral analysis.
Feature preview
- On/off toggle: Use the "Settings" icon to switch the "Order History" feature on or off (enabled by default).

- B (Buy) marker: Green marker showing your exact buy action.
- S (Sell) marker: Red marker identifying every sell transaction.
- Details pop-up: Tapping the marker brings up a card with key data (time, price, and count).
- Full breakdown: Tap the details card to open the "Order History" page and view your trading record.

Try now
Update your WEEX app to the latest version to experience our new Buy/Sell markers! Gain clarity and transparency in your trades, empowering smarter investment decision!
You may also like

Meet the new WEEX trial fund—your gateway to greater profits

WEEX Deposit/Withdrawal Dynamic Island: Your Asset Status, Always in Sight

Get Paid to Onboard? Try WEEX’s New Homepage with Rewards for Registration, Deposit & Trade

WEEX Custom Layout: Build Your Perfect Trading Workspace in Seconds

See “Buy Walls” & “Sell Walls” Instantly: WEEX Launches the Depth Chart for Smarter Trades

What Is Quick Trade on WEEX? 2 Ways WEEX Ends Chart-Panel Jumping

Guaranteed Price Now Live on WEEX: Execute with Greater Precision

Deposit Smarter & Faster: Discover WEEX’s Powerful Upgrade for Crypto and Fiat Deposit

WEEX New Navigation: Trade Faster, Find Trends, Copy Top Traders Instantly
TL;DRYou can now discover trending trading pairs faster with dedicated Spot and Futures themes.The platform automatically resumes your last viewed trading pair so you never lose your place.Simply hover over Copy Trade to see top-performing traders from the past three weeks.This upgrade is rolling out now to all WEEX users. Trading Slows You Down? Here’s How We Fix ItEvery tap, scroll, and menu click steals seconds from your trading. Missed trends. Lost progress. Hidden copy traders. Scattered asset views. That’s why WEEX rebuilt the top navigation — to remove every speed bump. Now you can catch trending pairs before they run, pick up exactly where you left off, find top-performing copy traders in one hover, and check your wallet without digging through menus. Less friction, faster decisions. 5 Navigation Boosts That Make You Trade SmarterHere’s what changed and why it matters for your daily trading:Trending Spot & Futures themes: Switch market themes and spot high-momentum pairs instantly. No more hunting.Auto-resume last pair: WEEX remembers your last viewed pair. Come back anytime, keep trading.One-hover copy trader discovery: Hover over Copy Trade to see top 3-week traders. Click into their pages instantly.Wallet shortcut in main navigation: One click to check balances, deposits, and withdrawals.Combined language & currency selector: View and switch both settings together. Personalize in seconds. Who Gets the Biggest Speed Gains?Everyone wins, but high-frequency and copy traders see the biggest efficiency jump.New traders learn faster — clean layout and visible copy trading lowers the barrier.Active spot & futures traders save minutes per session with auto-resume and trending filters.Copy trading followers find top performers in one hover instead of multiple clicks.Frequent asset movers love the Wallet shortcut for quick deposits and balance checks.Find New Navigation Features in Two ClicksHere's how you can find the new navigation features on WEEX homepage within a few clicks:Log in and look at the top bar (Spot, Futures, Copy Trade, Wallet, globe icon).Hover Copy Trade → see top 3-week traders.Click Spot or Futures → your last viewed pair loads automatically.Click the globe → switch language and currency side by side.Click Wallet → view all assets instantly. Start Trading Smarter — It’s Live NowThese upgrades are available now. No settings to enable. No extra cost.👉 Try the new WEEX navigation nowTrade faster. Miss less. WEEX. Thank you for trading with WEEX About WEEXFounded in 2018, WEEX has developed into a global crypto exchange with over 6.2 million users across more than 150 countries. The platform emphasizes security, liquidity, and usability, providing over 1,200 spot trading pairs and offering up to 400x leverage in crypto futures trading. In addition to the traditional spot and derivatives markets, WEEX is expanding rapidly in the AI era delivering real time AI news, empowering users with AI trading tools, and exploring innovative trade to earn models that make intelligent trading more accessible to everyone. Its 1,000 BTC Protection Fund further strengthens asset safety and transparency, while features such as copy trading and advanced trading tools allow users to follow professional traders and experience a more efficient, intelligent trading journey.Follow WEEX on social mediaX: @WEEX_OfficialInstagram: @WEEX ExchangeTiktok: @weex_globalYoutube: @WEEX_OfficialDiscord: WEEX CommunityTelegram: WeexGlobal Group

WEEX P2P now supports KES—Merchant Recruitment Now Open
WEEX P2P now supports COP—Merchant Recruitment Now Open
Track Markets At a Glance: New WEEX Price Widgets for iOS & Android
To streamline your market data access, WEEX has officially launched "Market Watchlist" desktop widgets
Major Upgrade on Web: 10+ Advanced Chart Styles for Deeper Market Insights
To deliver more powerful and professional analysis tools, WEEX has rolled out a major upgrade to its web trading charts—now supporting up to 14 advanced chart styles.

Auto Earn Bonus 2026: WEEX vs Binance vs Bybit vs OKX vs Kraken (Only 1 Pays Extra)
Auto Earn 2026: Binance? Bybit? No extra bonus. Only WEEX gives +0.5% + 300% APR referral. Limited-time. See exactly how much more you can earn.

Auto Earn 2026: WEEX Offers 0.5% Extra + 300% APR Bonus — More Than Binance & Bybit?
Most exchanges offer Auto Earn, but only WEEX adds an extra 0.5% bonus on balance growth + 300% APR referral rewards in 2026. Here’s how WEEX compares to Binance, Bybit, OKX, and Kraken — and why you might earn more with a simple toggle.
WEEX OTC Now Supports EUR Deposits via SEPA Bank Transfer
To provide a smoother, more accessible fiat on-ramp, WEEX OTC has added SEPA Bank Transfer.
All-new copy trading
To provide a safer trading experience and clearer fund management, WEEX is rolling out a major upgrade to its copy trading system.

WEEX P2P now supports GHS, ETB & ZAR—Merchant Recruitment Now Open
To make crypto deposits easier, WEEX has officially launched its P2P trading platform and continues to expand fiat support. We're excited to announce that the Ghana Cedi (GHS), Ethiopian Birr (ETB) and South African Rand (ZAR) are now available on WEEX P2P!
