- Buy Crypto
- Markets
 Futures
- Spot
- Copy Trade
- Earn
- More
Glassnode: Undercurrent Surges at $83k Resistance, BTC Enters Oscillating Accumulation "Deep Dive Zone"
Original Title: Stress Builds Below Resistance
Original Authors: Chris Beamish, CryptoVizArt, Antoine Colpaert, Glassnode
Original Translators: AididiaoJP, Foresight News
Abstract
· The Bitcoin price is still hovering near a crucial on-chain cost level, with support facing a test. Market needs sufficient confidence to avoid further structural weakening.
· Short-term holder sentiment is fragile. If the price fails to recover above a key breakeven line, recent buyers may face new selling pressure.
· Overall, holder behavior remains cautious. This indicates the current market is in a phase of absorbing chips rather than expanding upward.
· Liquidity remains a key variable. Despite decreasing participation, the price remains stable. However, for the rally to continue, follow-up buying pressure is still needed.
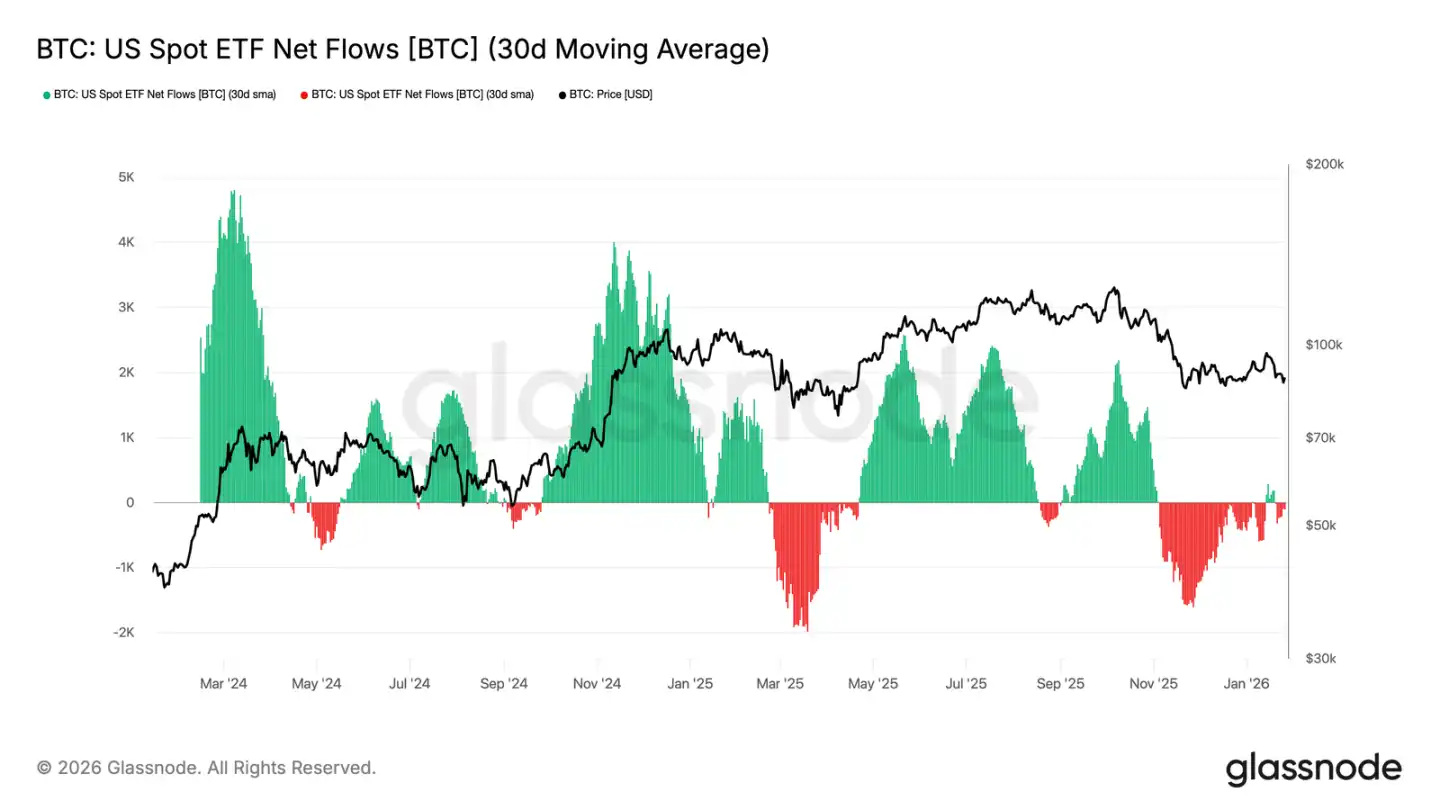
· Spot ETF fund flows are tending towards stability. After experiencing persistent outflows, the 30-day average fund flow has returned to near-neutral levels, alleviating mechanical selling pressure.
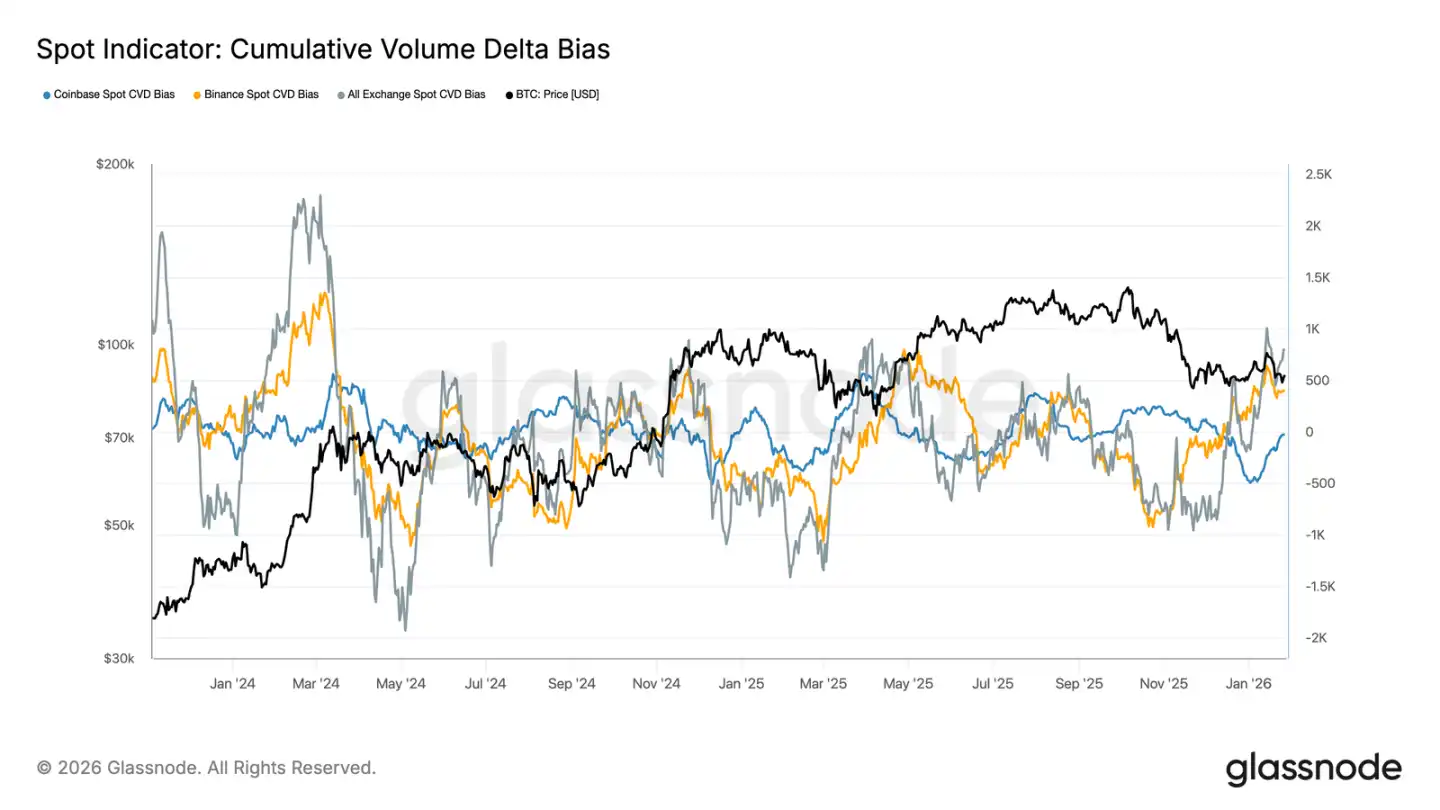
· Spot Cumulative Volume Differential (CVD) on various exchanges is showing a slight improvement, led by Binance, indicating marginal buying pressure is returning. Coinbase, on the other hand, remains relatively stable.
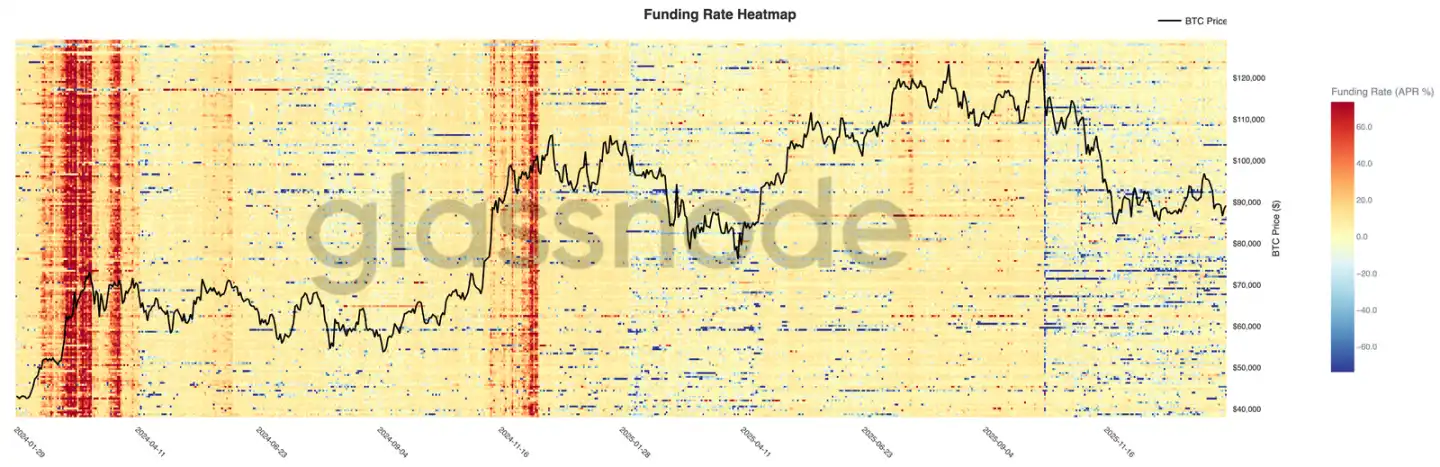
· Perpetual futures leverage levels remain low, with funding rates mostly neutral. Speculative positions still appear cautious, easily getting shaken out by volatility.
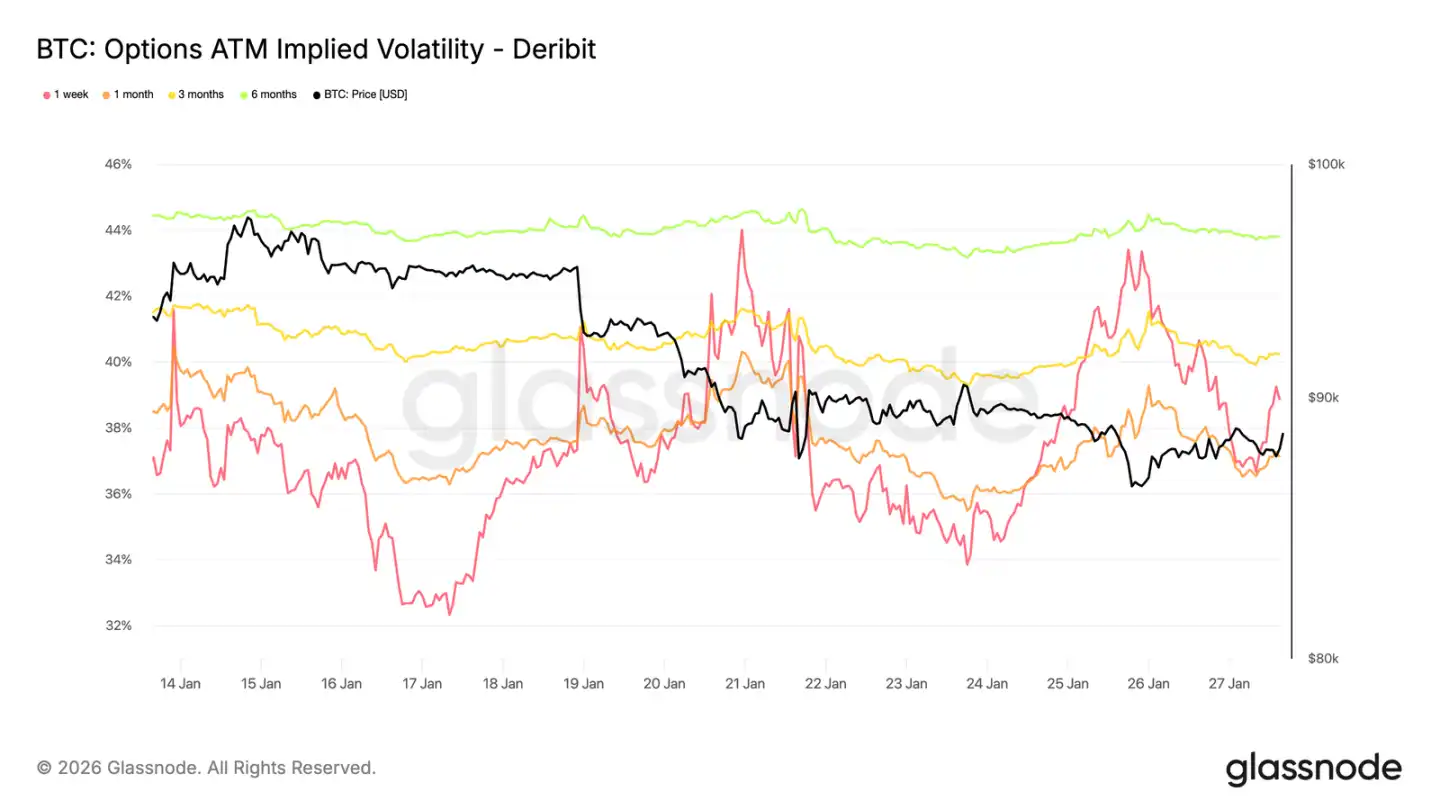
· The options market is shifting towards seeking downside protection: put options skew, rising short-term implied volatility, traders' Gamma values turning negative, increasing sensitivity to price downside.
On-Chain Insights
Recurring Weakness
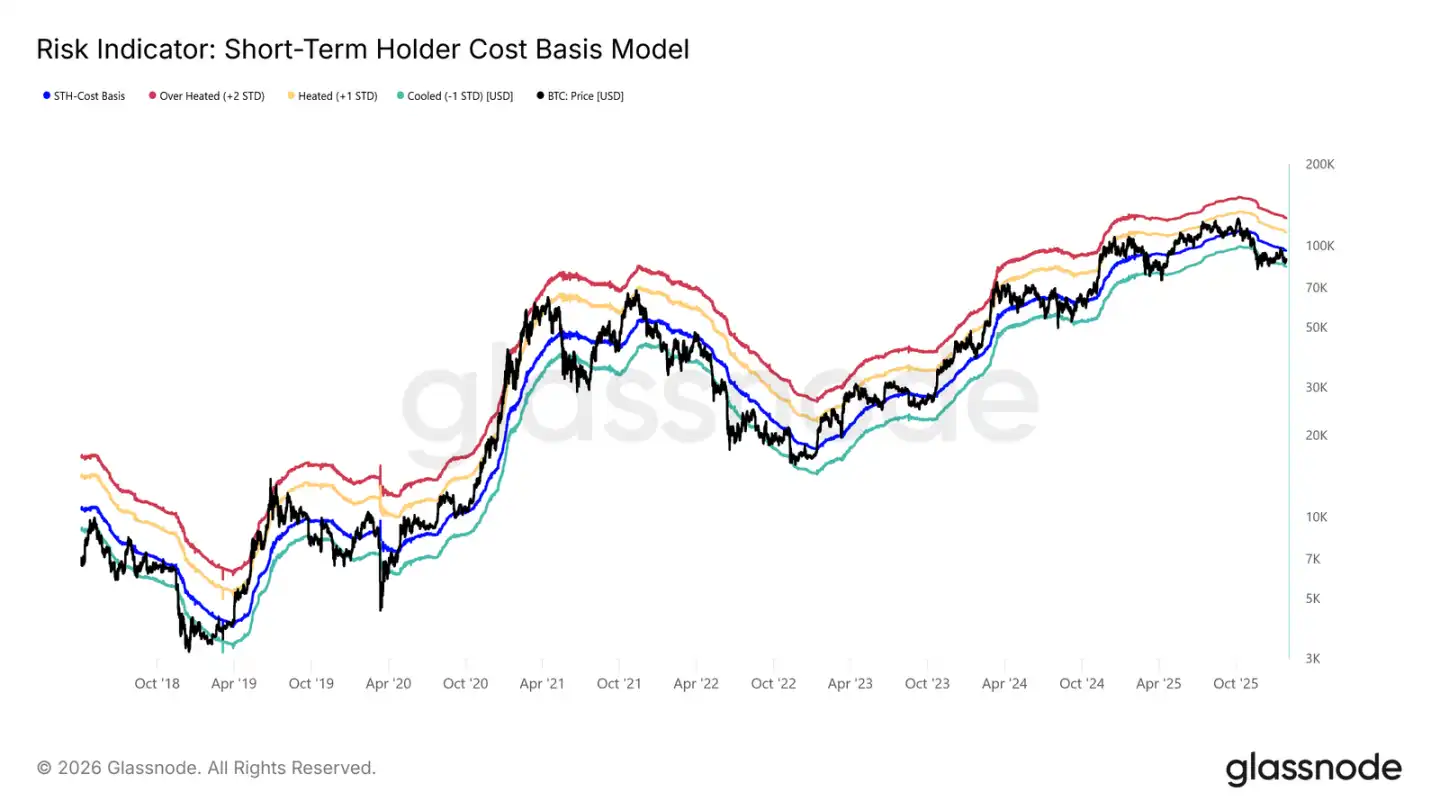
After failing to hold above the short-term holder cost, the market has experienced a minor pullback.
Currently priced below the key bull-bear boundary at $96,500, the market structure is very similar to the first quarter of 2022 and the second quarter of 2018.
As shown in the chart, the lower bound (-1 standard deviation) of the current consolidation range is at $83,400. This is a recent key support level, and if breached, it could trigger a deeper pullback, down to the $80,700 Realized Price.
Support Level Sensitivity
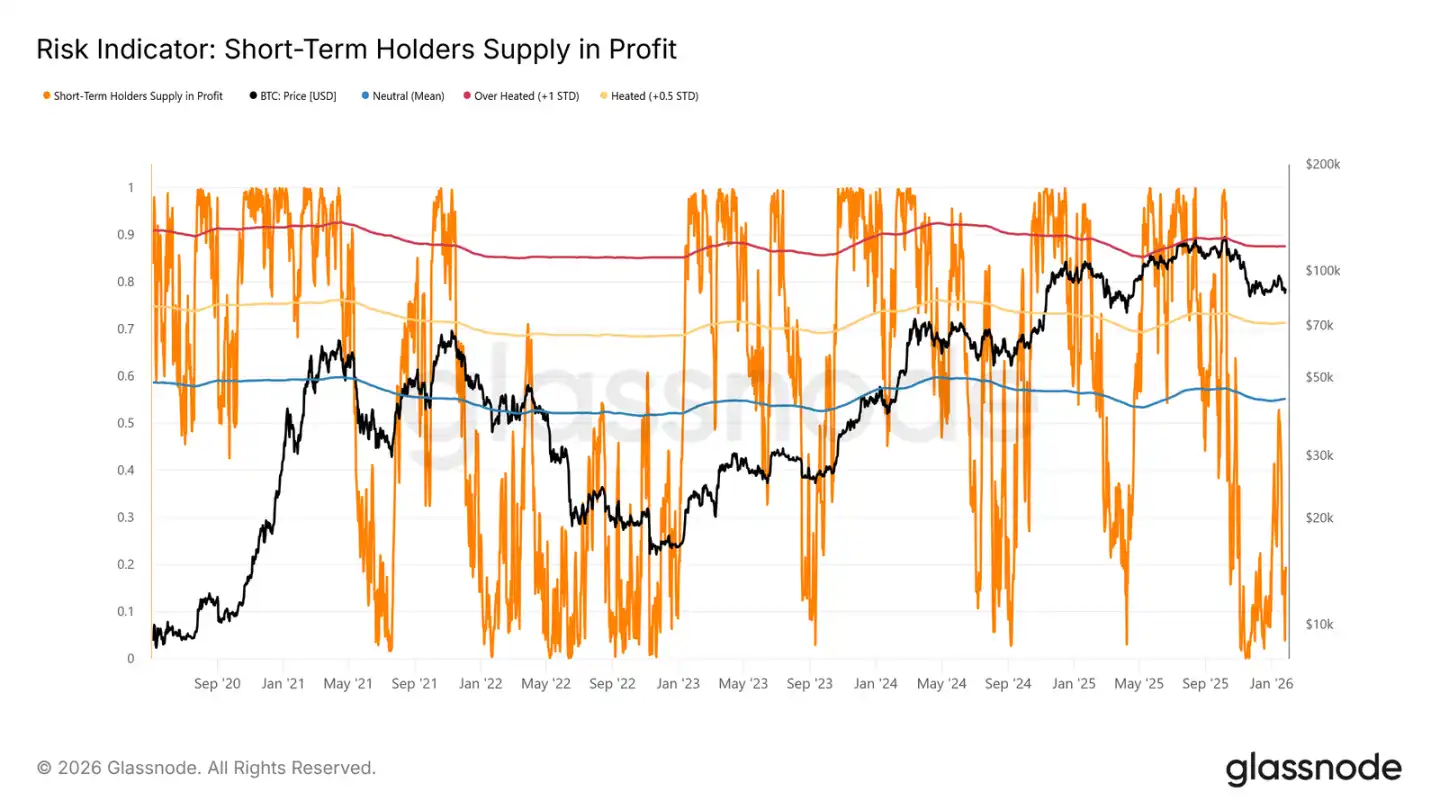
The market is so sensitive to the cost basis of short-term holders and the realized market price because a high proportion of recently acquired chips are at a loss. In this scenario, short-term holders who have historically been price-sensitive are more likely to sell at a loss, thereby increasing selling pressure.
Therefore, these price levels represent the last line of defense to prevent the market from sliding into a deep bear market similar to 2022-2023.
Currently, the proportion of loss chips held by short-term holders has dropped to 19.5%, well below the 55% neutral threshold. This indicates that while downside risk still exists, a large-scale panic sell-off by short-term holders has not yet occurred.
Liquidity is Key
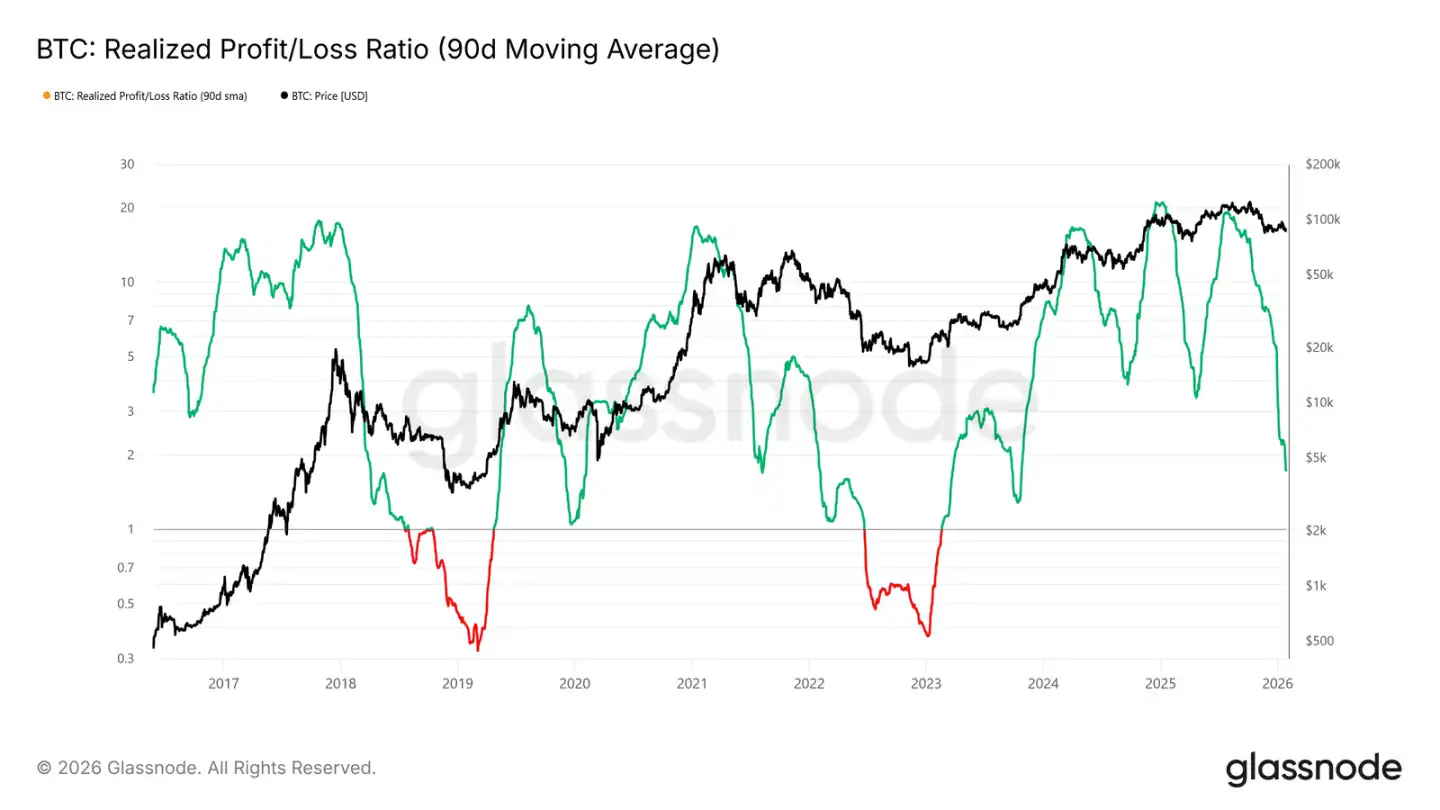
Given the importance of holding the key support area between $80,700 and $83,400, liquidity conditions have become the current focus. Any significant shift towards a sustainable rebound should be reflected in liquidity-sensitive metrics, such as the "Realized P&L Ratio (90-day moving average)."
Historically, including in cyclical rebounds over the past two years, robust upward phases require this metric to rise and remain around 5. This signals that new capital is re-entering the market.
Supply Under Pressure
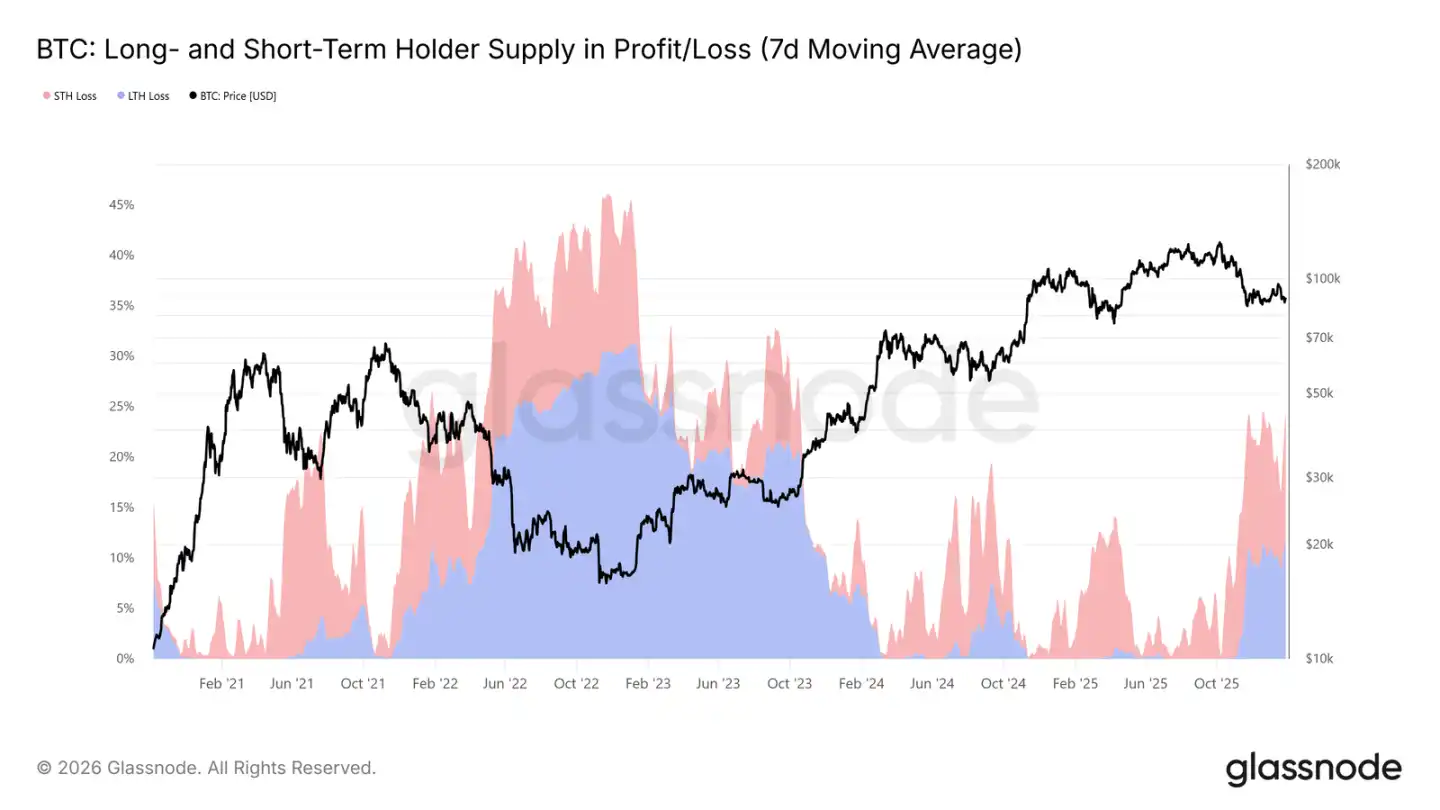
Another core on-chain indicator affecting the mid-term market structure is the "Long/Short Holder Profit/Loss Supply." This data shows that currently over 22% of the circulating supply is at a loss, similar to the situations in the first quarter of 2022 and the second quarter of 2018.
As chips bought at the top gradually "settle" into long-term holdings, and investors choose to hold coins bought during the previous uptrend, the proportion of loss held by long-term holders increases over time.
These steadfast holders are currently facing dual pressures of time and price. If the price falls below the aforementioned key support levels (cost basis of short-term holders and the realized market price), it could lead long-term holders to also choose to stop-loss, increasing mid-term downside risk.
On-chain Insights
Spot ETF Outflows Easing
The net fund flow of the U.S. spot Bitcoin ETF has returned to equilibrium. After experiencing long-term outflows, its 30-day moving average is approaching the zero line. This indicates that the structural selling pressure brought by the ETF has significantly eased.
It is worth noting that the recent inflow of funds rebounded much less vigorously than the several accumulation surges at the beginning and end of 2024. This indicates that institutional demand remains cautious rather than actively chasing prices higher. Despite the weakening momentum of fund inflows, the BTC price can still maintain its position in a higher range, seemingly relying more on the belief of spot holders rather than on ETF-driven demand.
If fund flows can return to a sustained net inflow state, it will be favorable for the continuation of the uptrend. Conversely, if this cannot be achieved, BTC may continue to consolidate, as the market lacks the external liquidity injection that previously drove the rise.
Improvement in Spot Fund Flows
The spot CVD bias of major trading platforms is trending upwards, indicating that buying pressure in the market is returning after a prolonged period of weakness. Binance is leading the rebound, quickly recovering from deep negative values; the aggregated CVD bias of all trading platforms has also turned positive.
However, Coinbase's CVD bias is still fluctuating within a range, suggesting that onshore spot demand in the U.S. is relatively stable but not as active as in offshore markets. This difference indicates that the return of marginal buying pressure is being primarily driven by global risk appetite rather than decisive buying in the U.S. market.
If buying dominance can be sustained, it will support further price stabilization or even an upswing. However, in this current cycle, the market has repeatedly failed to maintain a positive CVD trend, so whether subsequent buying pressure can persist will be crucial.
Perpetual Futures Market Remains Calm
The perpetual funding rates on various exchanges mostly remain neutral despite significant price fluctuations. This indicates that leverage has been cleared, with long and short positions relatively balanced, and neither side has been consistently paying high funding fees.
It is worth noting that brief spikes in positive funding rates still occur during local rebounds, reflecting short-lived bullish chasing behavior. However, these spikes are not sustained, affirming the view that speculative sentiment is fragile and easily fades.
In a scenario of compressed and imbalanced funding rates, the market is increasingly relying on spot demand to drive the trend. If funding rates can remain positive, it indicates a resurgence of leverage and risk appetite. If they remain neutral, it suggests the market may enter a slow and choppy consolidation phase.
Implied Volatility: Short-Term Rise, Long-Term Stability
Over the past weekend, short-term at-the-money implied volatility experienced a sharp increase, reflecting the market's heightened sensitivity to the overall short-term risk environment (beyond just cryptocurrency itself).
This shift coincides with increasing geopolitical uncertainty and escalating macro risks, which typically first impact the front end of the volatility curve. Volatility repricing is concentrated in short-term options, while long-term option volatility remains relatively stable.
This indicates that the market is reassessing short-term uncertainty rather than altering long-term risk expectations. It is a response to external risks and shows no signs of internal pressure or structural imbalance.
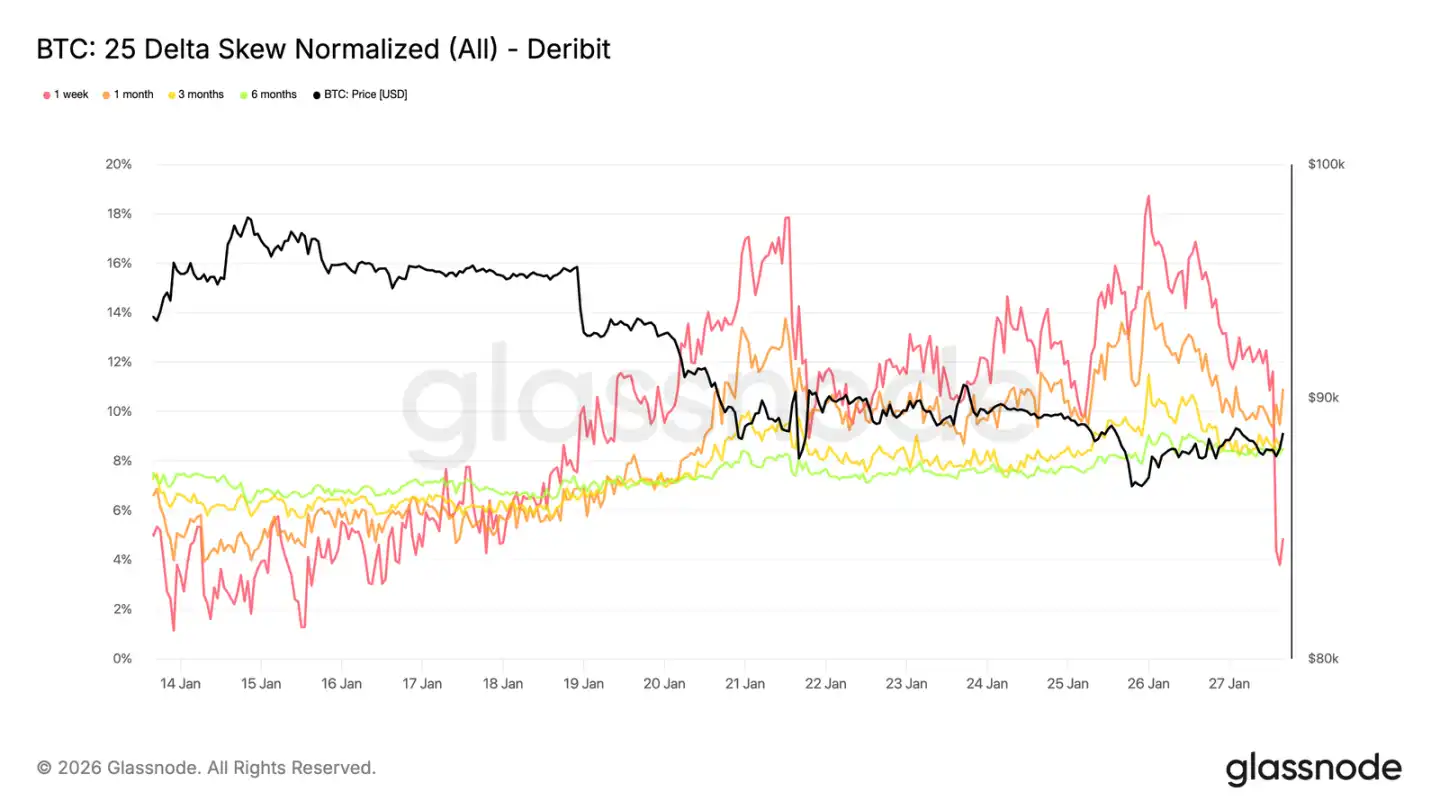
25 Delta Skew: Bearish Sentiment Spreading
As volatility adjusts, skew can more clearly reflect market sentiment. The 25 Delta skew for various maturities has all shifted to a bearish stance, indicating a relatively increased demand for downside protection.
This shift implies a more cautious view on the medium to long term, although the spot price trend remains orderly. The adjustment is gradual, indicating planned hedging activity rather than panic buying of puts.
The short-term skew (especially for one-period tenors) shows higher volatility, while the overall curve is slightly bearish compared to last week. This difference shows that the market is expressing caution across different time frames but has not descended into extreme tension.
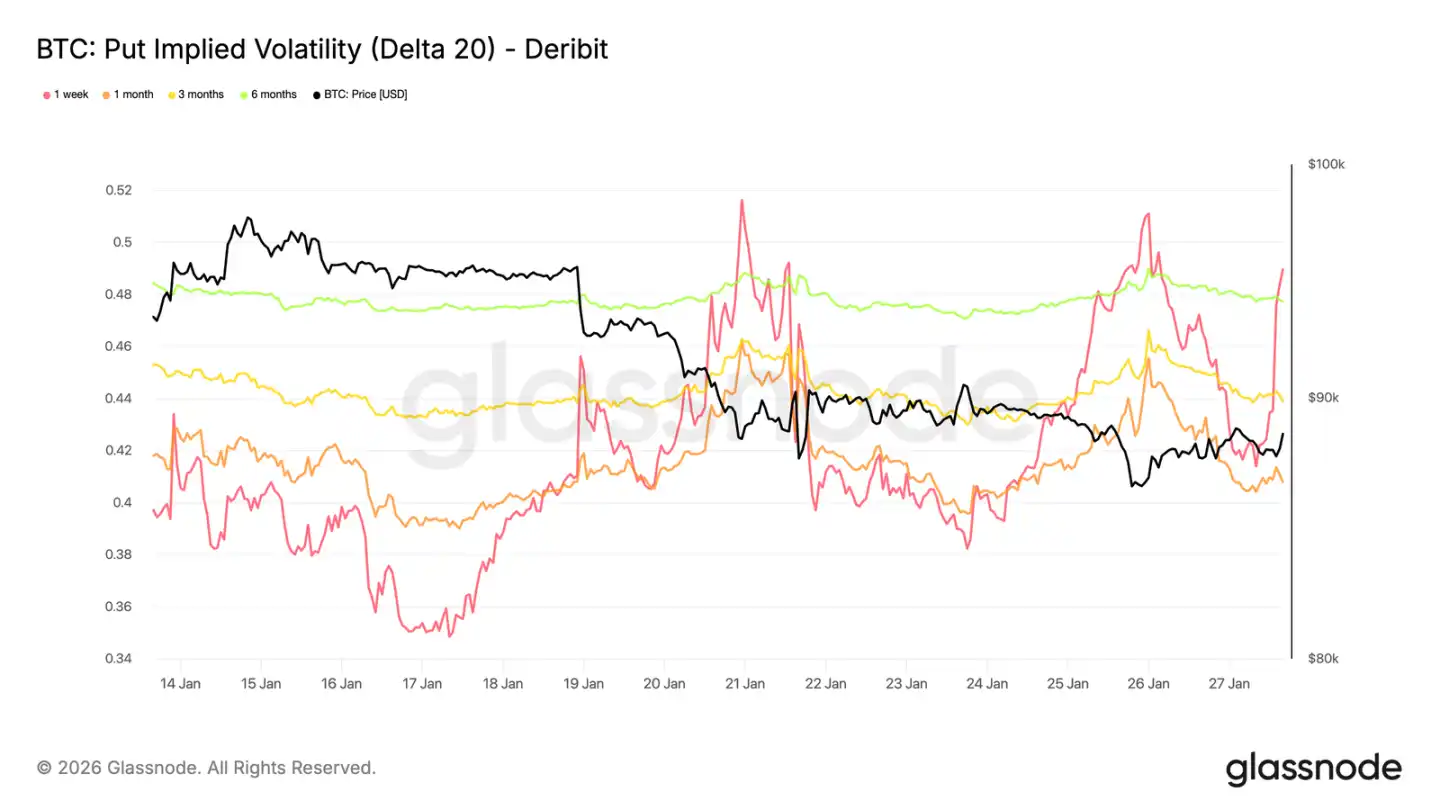
Downside Implied Volatility: Protective, Yet Not Pricing in a Meltdown
By interpolating specific delta implied volatilities, we can smoothly observe the volatility surface across maturities. Here, we focus on the 20 Delta put options, which clearly reflect the long-term demand for downside protection.
Despite bearish skew, the downside implied volatility for various maturities remains relatively moderate. Even when looking at options expiring at the end of 2026, the market is only pricing in a slight decline.
This reveals a crucial detail: participants are willing to pay a higher cost for downside protection than for upside potential, but they do not believe a severe downturn is imminent. Market sentiment is notably defensive, but expectations for the extent of a downturn remain limited.
This aligns with the recent characteristic of the spot market, showing an "orderly decline rather than panic selling."
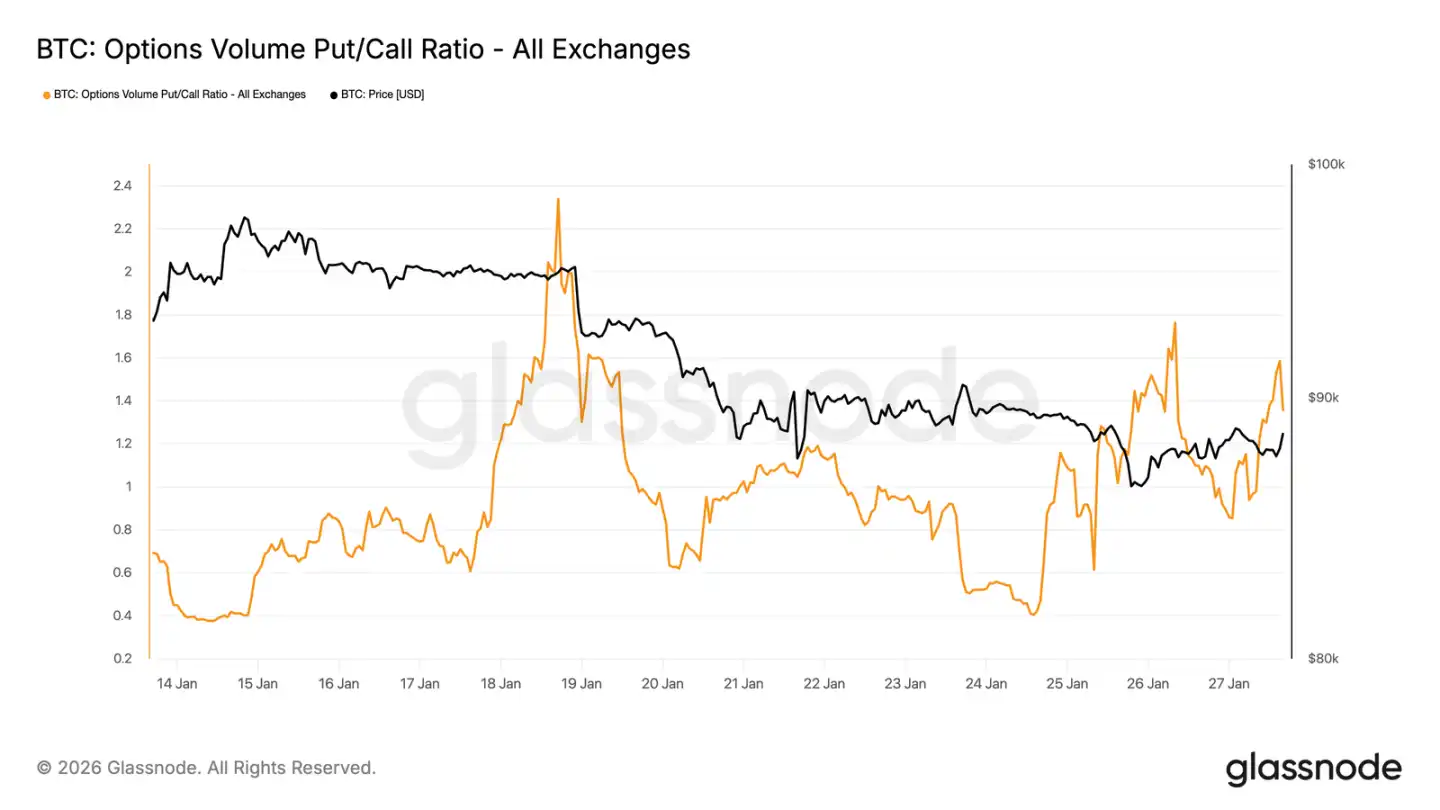
Put Option Trading Volume Leading
Looking at the trading volume, the put/call ratio in the options market also confirms this defensive posture. Put option trading volume has increased relative to call options, but there has not been a surge in volume typically associated with panic hedging.
The volume is active but orderly, indicating that traders are gradually adjusting positions rather than emotionally chasing market swings. This aligns with the market's recognition of downside risk and the cautious tone of slowly easing downward in a controlled manner.
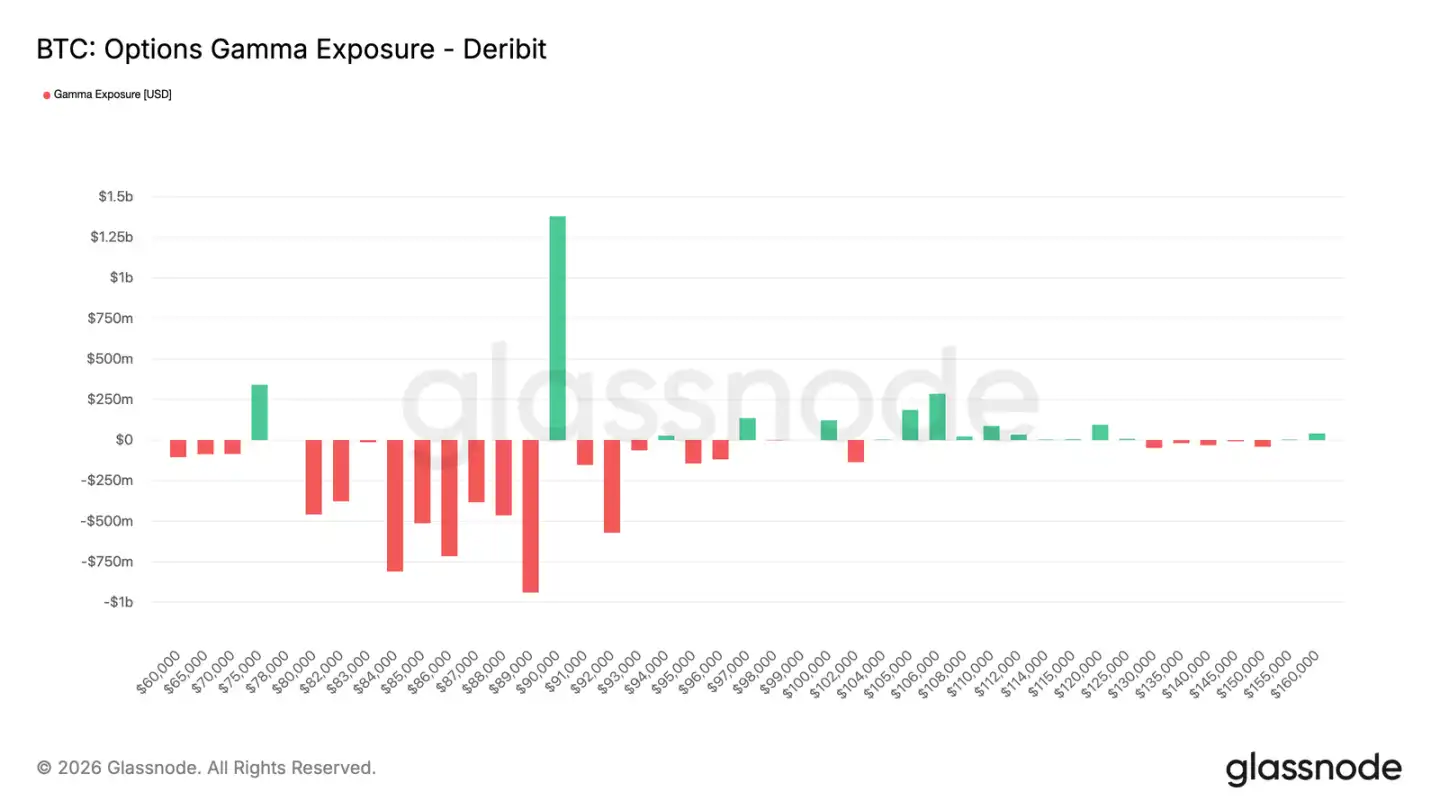
Trader Gamma: Sub-$90,000 Favors Downside
Trader Gamma exposure reveals a key structural feature of the current market. Traders hold a significant amount of short Gamma from around $90,000 down to approximately $75,000, a range that coincides with a crucial support zone.
In a short Gamma environment, traders' hedging behavior amplifies price swings. As the spot price drops, traders sell futures or spot to hedge their short put option risk, mechanically intensifying the downward momentum. This explains why even without significant selling pressure, pullbacks can deepen.
Simultaneously, a significant concentration of long Gamma still exists around the $90,000 level. This means that breaking above this price requires sustained and robust buying pressure, not sporadic buying.
Prior to the above conditions materializing, the market structure is more conducive to a slow and controlled price downtrend rather than a swift reversal.
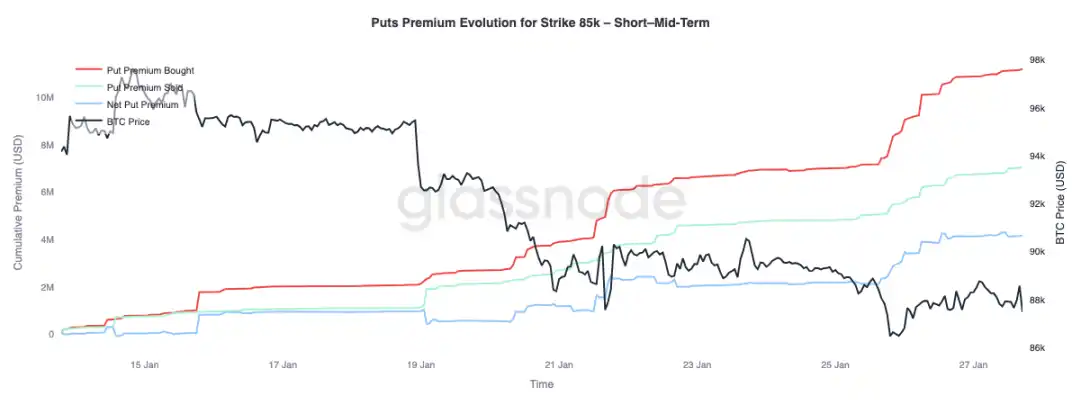
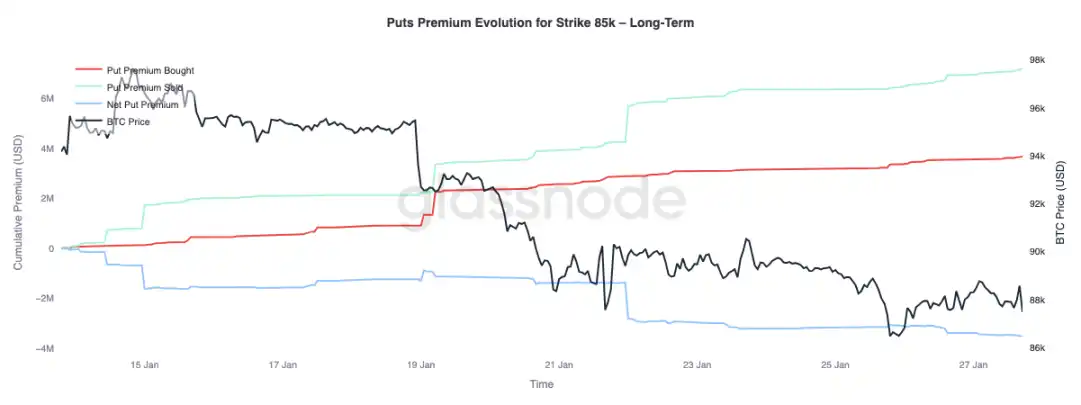
Put Option Premium: Buy Short, Sell Long
Observing the put option premium change focusing on an $85,000 strike reveals a differentiation in behavior across maturities: short-term options within three months show a dominant net buying of premiums, driving the net premium up; meanwhile, long-term options of over three months exhibit a net selling of premiums.
This reflects the market's reaction to Bitcoin's move from the $90,000 mid-range to the $80,000 high-range: hedging against short-term downside risk while being willing to sell long-term downside protection. This structure indicates that the market is only short-term cautious, with long-term risk expectations not deteriorating.
Conclusion
Bitcoin continues to consolidate near crucial on-chain levels, with a delicate balance between holder conviction and marginal demand. Short-term holders remain fragile, and a breach of support levels could trigger a new round of selling.
However, overall fund flows have stabilized: ETF selling pressure has eased, on-chain market positions (especially in offshore markets) show initial signs of improvement, indicating a revival of buying interest. Additionally, the derivatives market shows restraint, with a neutral funding rate suggesting low market leverage and reduced price dependence on speculative funds.
Option positions reinforce a cautious market sentiment: a skew towards puts, rising short-term protection demand, and trader Gamma turning negative increase the risk of intensified price volatility.
The future direction depends on whether the demand through spot and ETF channels can be sustained. If fund flows can return to sustained net inflows and spot buying interest strengthens, it will support the continuation of the trend; conversely, if market fragility persists and hedging demand against downside risk increases, it may face further consolidation or a deep pullback.
You may also like

Who is the true winner of the "Tokenization" narrative?

Moss: The Era of AI-Traded by Anyone | Project Introduction

Chip Smuggling Case Exposes Regulatory Loophole | Rewire News Evening Update

How a Structured AI Crypto Trading Bot Won at the WEEX Hackathon
Ritmex demonstrates how disciplined risk control and structured signals can make an AI crypto trading bot more stable and reliable on WEEX, highlighting the importance of combining execution discipline with scalable AI trading systems.

Old Indicator Fails, Three Major New Signals Emerge: BTC True Bottom May Still Be Below $60K

Meeting OpenClaw Founder at a Hackathon: What Else Can Lobsters Do?

Huang Renxun's Latest Podcast Transcript: NVIDIA's Future, Embodied Intelligence and Agent Development, Soaring Demand for Inferencing, and AI's PR Crisis
How a Structured AI Crypto Trading Bot Won at the WEEX Hackathon
Crypto_Trade shows how structured inputs and controlled adaptability can build a more stable and reliable AI crypto trading bot within the WEEX AI Trading Hackathon, highlighting a practical path toward scalable AI trading systems.

AI Starts to Devour the Manufacturing Industry | Rewire News Morning Edition

When Scaling Meets Speed, Ethereum Foundation Introduces "Hardness" to Safeguard the Base Layer
Google, Circle, Stripe Flock Together to Let AI Spend Money: Payment Giants' Joys and Worries in 2026 Q1

$100 Billion Factory Purchase: Bezos and Middle Eastern Capital Shift AI Money from Cloud to Shop Floor

Xiaomi and MiniMax both unleash their ultimate moves, signaling the start of the Agent Pricing War.

Predicting markets has taken the spotlight, but the Perp DEX has been quietly waging war on traditional exchanges.

Is the Market Slump Still Making Millions a Day? Is pump.fun's Revenue Real?
Understanding x402 and MPP in One Article: The Two Paths of Agent Payments

Quick Look at the Latest 18 Graduation Projects from Alliance: Who's the Next Pump.fun?

It's not just the prediction market that profits from the Iraq War
Who is the true winner of the "Tokenization" narrative?
Moss: The Era of AI-Traded by Anyone | Project Introduction
Chip Smuggling Case Exposes Regulatory Loophole | Rewire News Evening Update
How a Structured AI Crypto Trading Bot Won at the WEEX Hackathon
Ritmex demonstrates how disciplined risk control and structured signals can make an AI crypto trading bot more stable and reliable on WEEX, highlighting the importance of combining execution discipline with scalable AI trading systems.