
What Is a Moving Average (MA)? Types and How to Read Them

 Prefer us on Google


A moving average, or MA, is one of the most widely used tools in technical analysis. It smooths out a price chart by continuously averaging the price over a chosen number of periods, so that short-term noise fades and the underlying trend becomes easier to see. Instead of reacting to every jagged tick, a trader can look at a single flowing line that summarises recent price behaviour.
How a moving average works
The idea is simple: take the closing prices of the last N periods, average them, and plot the result. As each new period arrives, the oldest price drops out and the newest is added — so the average "moves" forward in time. A 20-day moving average, for example, always reflects the most recent 20 days.
There are two common types:
- Simple Moving Average (SMA): a plain average that weights every period in the window equally.
- Exponential Moving Average (EMA): a weighted average that gives more importance to recent prices, so it reacts faster to new moves.
Shorter windows (such as a 20-period MA) hug the price closely and turn quickly; longer windows (such as a 200-period MA) move slowly and represent the bigger, longer-term trend.
How traders read moving averages
Moving averages are used in several ways. The slope of the line gives a quick read on direction: a rising MA suggests an uptrend, a falling MA a downtrend. The price's position relative to the line matters too — trading above a key MA is often read as constructive, below it as weak. Some traders also treat moving averages as dynamic support or resistance.
Crossovers between two MAs are especially watched. When a shorter average crosses above a longer one, the pattern is called a golden cross, covered in the golden cross; when it crosses below, it is a death cross, covered in the death cross. Moving averages also underpin more advanced systems, including the Japanese indicator explained in the Ichimoku Cloud.
An important limitation
A moving average is a lagging indicator: because it is built from past prices, it always trails the current move. It confirms trends rather than predicting them, and in sideways, choppy markets it can produce misleading signals as price whips back and forth across the line. Traders generally treat MAs as one input among several, not a standalone system.
A worked example
Suppose a trader plots a 50-period and a 200-period moving average on a chart.
- Price is trading above both lines, and both are sloping upward — a picture many read as a healthy uptrend.
- The shorter 50-period line acts as a level price bounces off during pullbacks.
- If momentum fades and the 50-period line eventually crosses below the 200-period line, that death cross is watched as a possible shift in trend.
Because MAs lag, acting on them without other confirmation carries risk, and leverage magnifies that risk. Anyone applying these tools in futures or perpetual contracts should manage position size and predefine risk. This is educational information, not trading advice.
Related concepts
- Golden cross: a bullish MA crossover — the golden cross.
- Death cross: a bearish MA crossover — the death cross.
- Ichimoku Cloud: a broader indicator built on averaged prices — the Ichimoku Cloud.
Summary
A moving average smooths price data to reveal the underlying trend, and comes in simple (SMA) and exponential (EMA) forms with different responsiveness. Traders read its slope, the price's position relative to it, and crossovers between two averages. Its key weakness is lag, so it is best used as one confirming tool rather than a signal on its own.
This article is for educational and informational purposes only and does not constitute investment, financial, or tax advice. Cryptocurrency and derivatives trading involve significant risk. Always do your own research.
Disclaimer: This content is provided for general branding and informational purposes only and doesn't constitute financial, investment, legal, or tax advice. Any events, rewards, online events, or related information mentioned herein should not be considered a recommendation, solicitation, or invitation to purchase, sell, trade, or otherwise deal in any crypto assets or to use any services. Crypto assets are highly volatile and may result in loss. WEEX services and online events may not be available in all regions and are subject to applicable laws, regulations, and eligibility requirements. You are responsible for ensuring that your use of WEEX services complies with local laws and for carefully assessing the risks before participating in any crypto-related activities.
You may also like

Gold Price Outlook 2026: Third-Party Analyst Scenarios (Maintained, Educational)

Silver Price Outlook 2026: Third-Party Analyst Scenarios (Maintained, Educational)
How to Buy Bitcoin in Brazil: A Step by Step Guide for Beginners

Dolar Crypto in Argentina: How to Use Stablecoins for Dollar Exposure and Buy Bitcoin
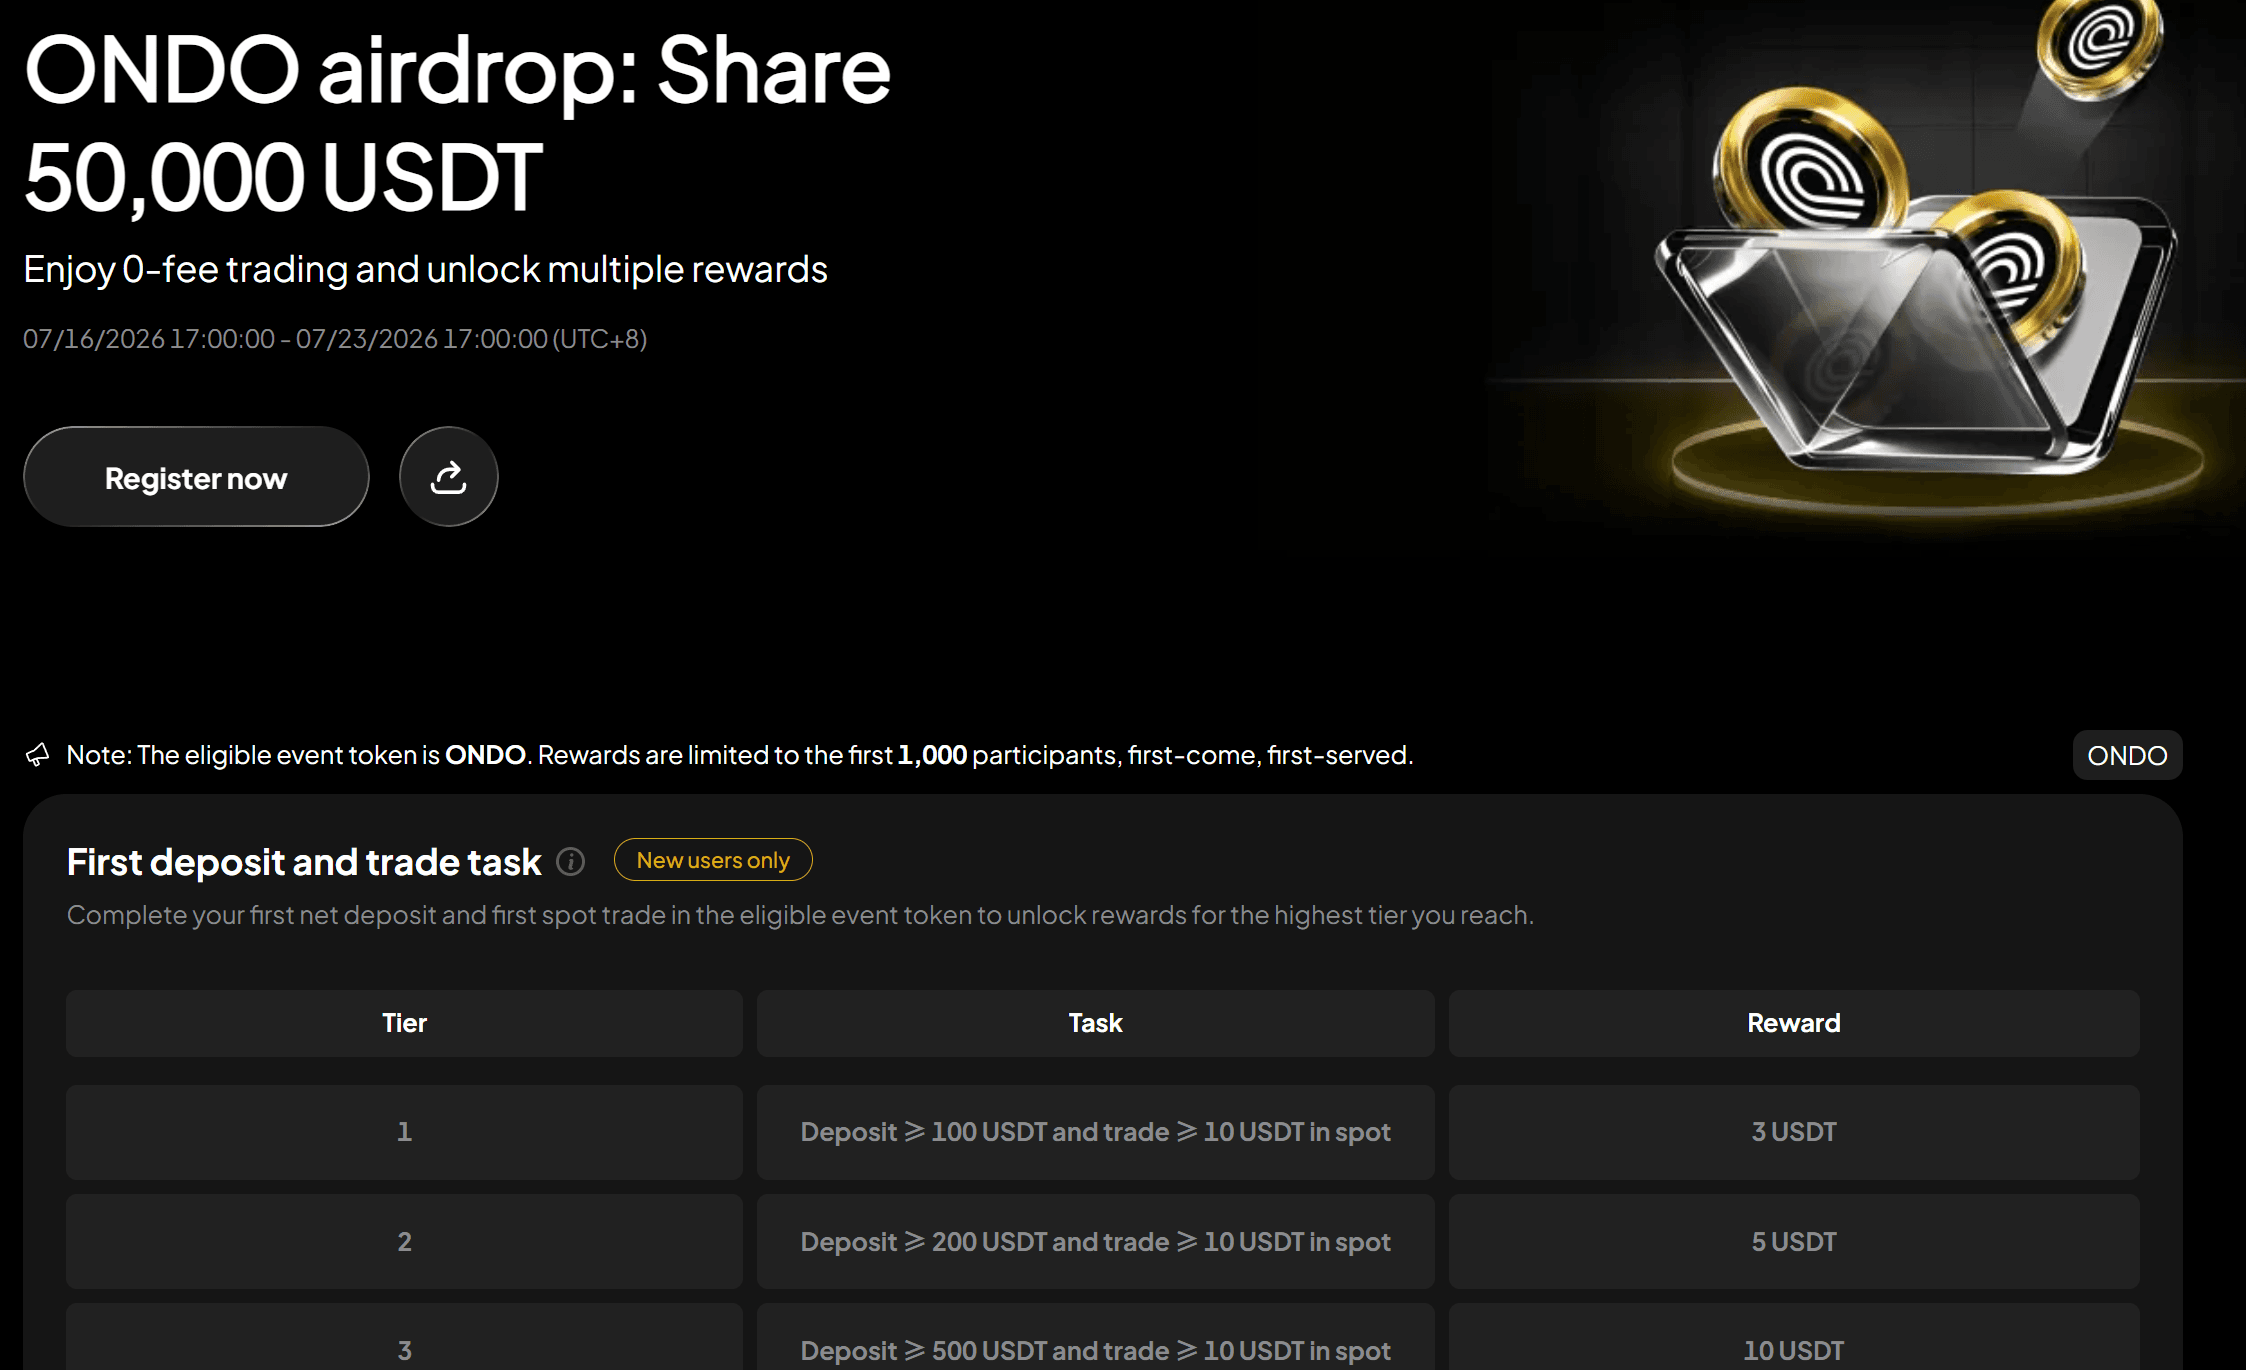
Claim ONDO Airdrop Rewards: Complete Tasks and Share 50,000 USDT
Claim ONDO Airdrop rewards on WEEX and share 50,000 USDT. Learn how to join, complete trading tasks, earn bonuses, and trade ONDO/USDT during the event.

Japan's Crypto Regulation Basics: The FSA, JVCEA, and User Protections

How Overseas Crypto Exchanges Work for Japan Residents (and the Risks)
Modelo 721 Explained: Declaring Foreign Crypto Holdings in Spain

DEX vs CEX for Perpetuals: Trading Perps On-Chain vs on an Exchange

What Is an On-Chain Order Book? How Order-Book DEXs Work
What Is a Perp DEX? Perpetual Futures on Decentralized Exchanges
Italy Crypto Tax 2026: The Capital Gains Rate Rises to 33%
Support and Resistance: How to Identify Key Levels on the Chart

Supply and Demand Zones: A Smart-Money Trading Guide
Price Action Trading: Reading Raw Market Behavior

Head and Shoulders Pattern: How to Spot and Trade It
Classic Chart Patterns: Triangles, Double Tops/Bottoms and Flags
Airdrop Farming: How to Farm Crypto Airdrops the Right Way
What Is Elliott Wave Theory? A Beginner's Guide to Counting Waves
What Is Fibonacci Retracement? How to Draw and Use It
What Is the Ichimoku Cloud? A Beginner's Guide to Reading It
What Is the VIX (Fear Index)? How to Read It and Its Link to Crypto
What Is Dow Theory? The Six Principles Explained
What Is a Death Cross? Understanding the Bearish Signal
What Is a Golden Cross? A Beginner's Guide to the Bullish Signal
MiCA Regulation: What Changes for Polish Crypto Investors
Open Interest: What It Means in Futures Trading
Call vs Put Options: What They Are and How They Differ
What Are Sakata's Five Methods? Classic Candlestick Patterns Explained
What Is the FOMC? Meeting Schedule and Why Crypto Reacts
Gold Price Outlook 2026: Third-Party Analyst Scenarios (Maintained, Educational)
Silver Price Outlook 2026: Third-Party Analyst Scenarios (Maintained, Educational)
How to Buy Bitcoin in Brazil: A Step by Step Guide for Beginners
Dolar Crypto in Argentina: How to Use Stablecoins for Dollar Exposure and Buy Bitcoin
Claim ONDO Airdrop Rewards: Complete Tasks and Share 50,000 USDT
Claim ONDO Airdrop rewards on WEEX and share 50,000 USDT. Learn how to join, complete trading tasks, earn bonuses, and trade ONDO/USDT during the event.
Japan's Crypto Regulation Basics: The FSA, JVCEA, and User Protections



